Sight to Sound
This is a sight-to-sound application; something that takes a camera input and outputs a spectrum of audio frequencies. The creative task is to choose a mapping from 2D pixel-space to 1D frequency-space in a way that could be meaningful to the listener. Of course, it would take someone a long time to relearn their sight through sound, but the purpose of this project is just to implement the software.
Used here, the mapping from pixels to frequencies is the Hilbert Curve. This particular mapping is desirable for two reasons: first, when the camera dimensions increase, points on the curve approach more precise locations, tending toward a specific point. So increasing the dimensions makes better approximations of the camera data, which becomes "higher resolution sound" in terms of audio-sight. Second, the Hilbert Curve maintains that nearby pixels in pixel-space are assigned frequencies near each other in frequency-space. By leveraging these two intuitions of sight, the Hilbert curve is an excellent choice for the mapping for this hypothetical software.
The video below demonstrates the concept in Max. For a better understanding, check out this video by YouTube animator 3Blue1Brown: link
Here is a walkthrough of the code:

|
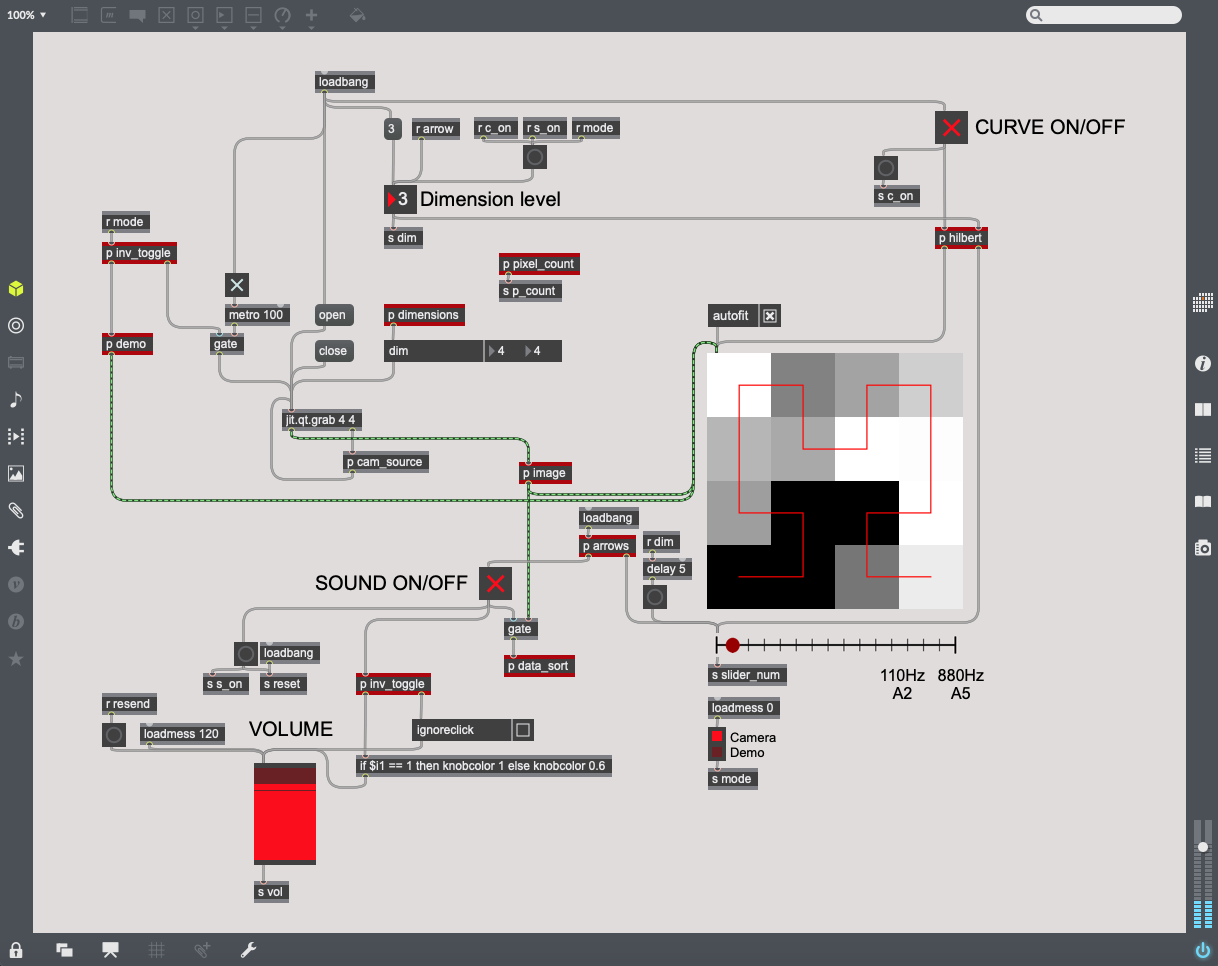 This is the main patcher. It looks complicated, but there are only two primary paths running. |
|
|
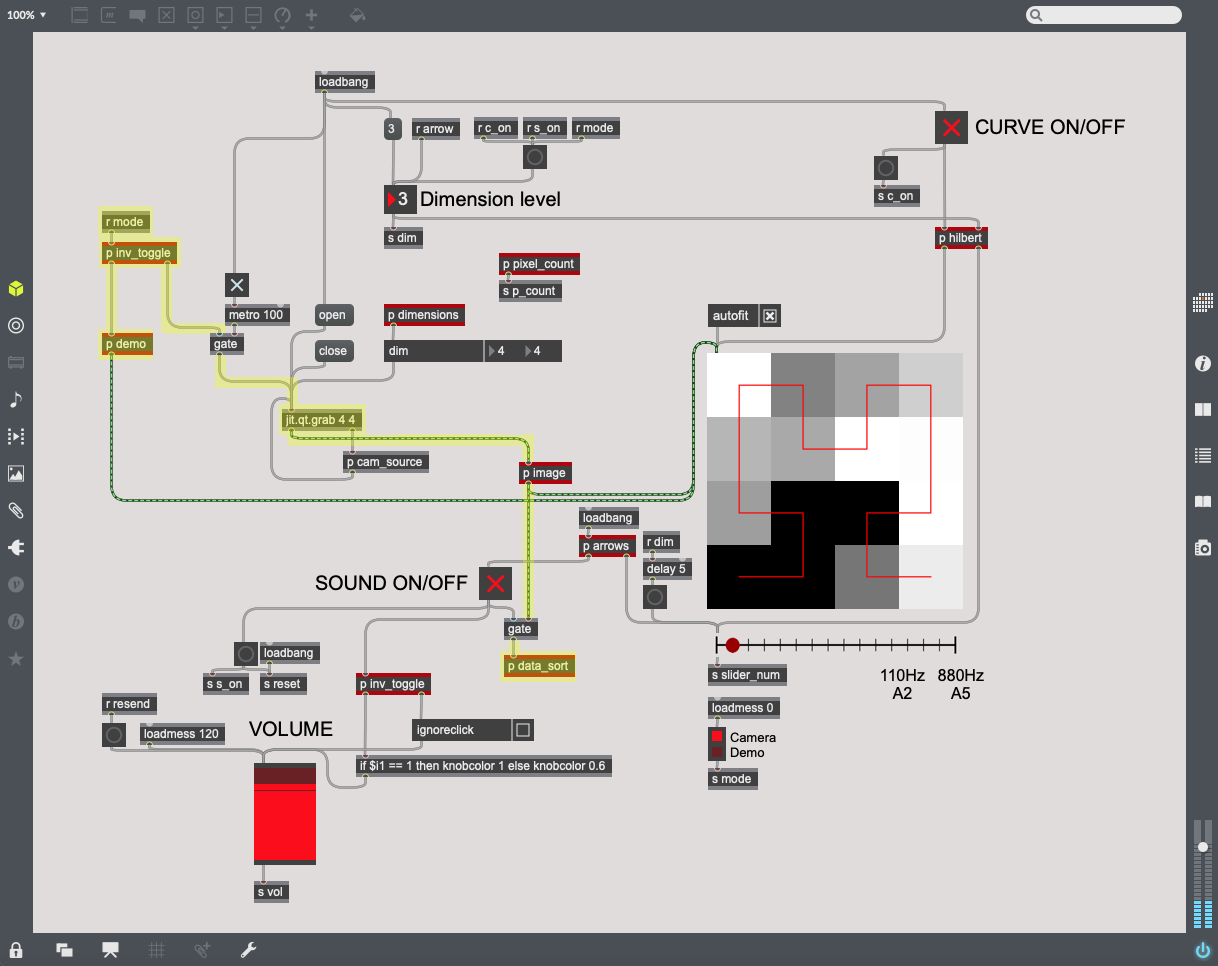 This path controls the current mode. The left branch runs the demo mode, and the right branch runs the camera mode. p inv_toggle acts as a router between 0 and 1, but with toggles. |
|
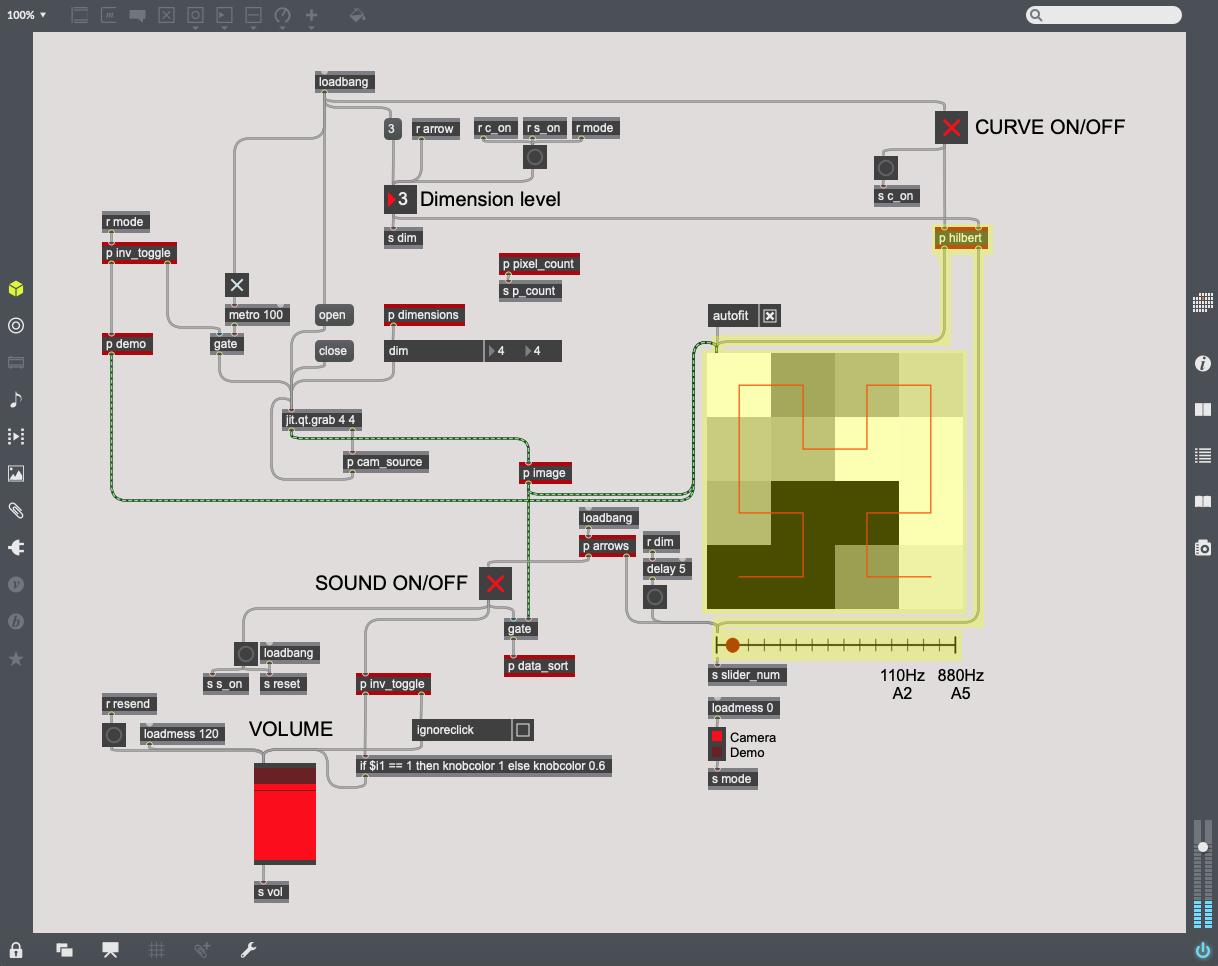 This path controls the Hilbert Curves and the sliders for each dimension level. |
|
|
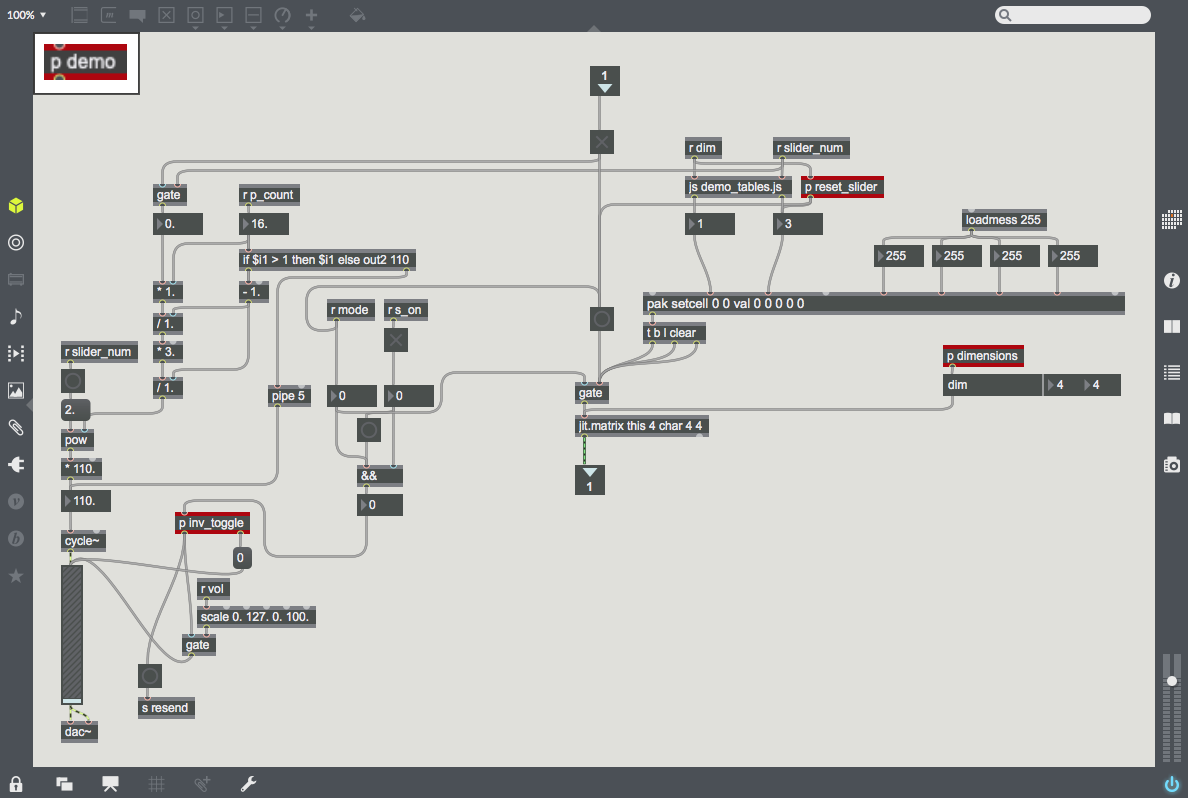 This subpatcher p demo runs the demo mode. The left half outputs the selected frequency, and the right half generates the matrix output for the video screen. |
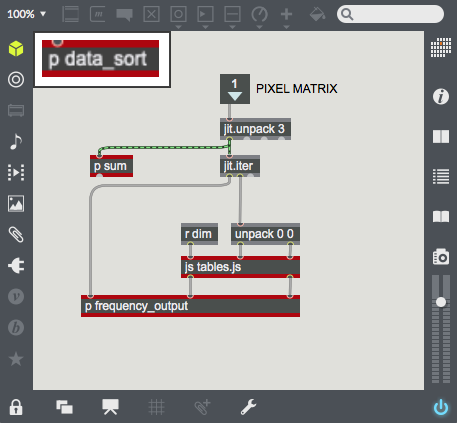 This subpatcher p data_sort begins running the camera mode. |
|
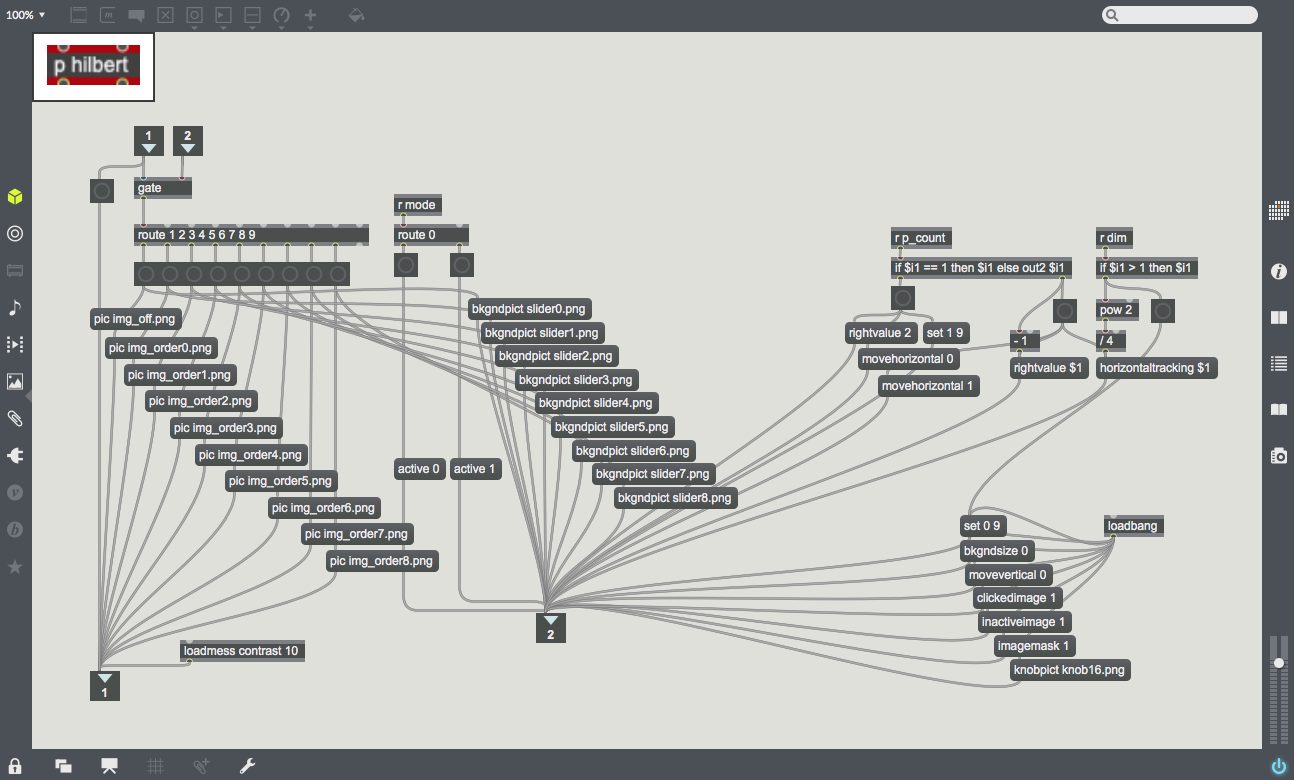 This subpatcher p hilbert sends the proper Hilbert Curves and sliders from image files. |
|
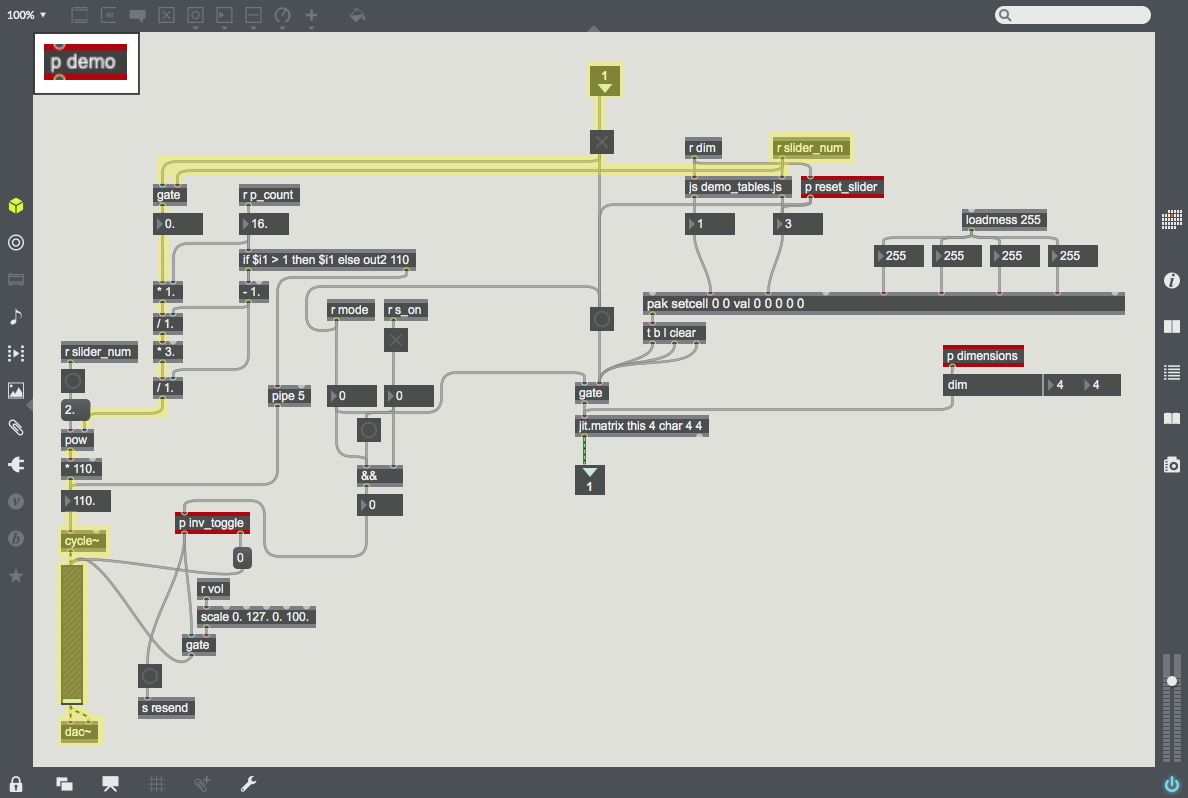 This half of p demo uses the place along the Hilbert Curve (also the slider value) to calculate and output that point's frequency. |
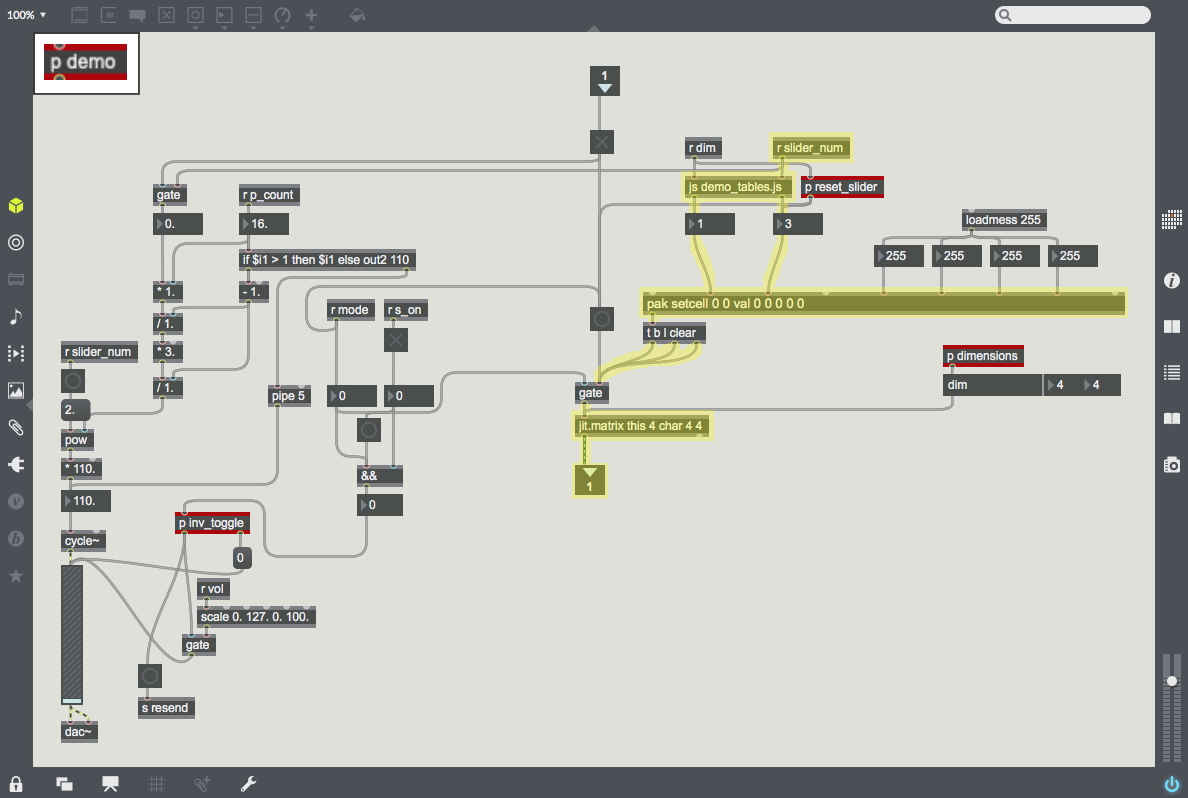 This half of p demo uses javascript to take the place along the Hilbert Curve (also the slider value) and output the xy-coordinates of the corresponding pixel. Then, it generates a matrix of black pixels with a white pixel at that point (x,y). |
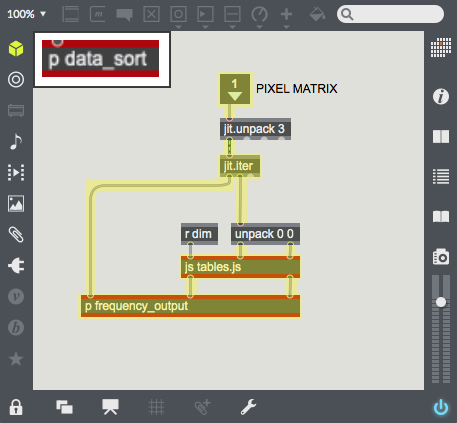 jit.iter splits the camera data into pixel coordinates and their brightness values. The javascript file takes each pixel's xy-coordinates and outputs that pixel's place on the Hilbert Curve (from first to last, when unraveled). |
|
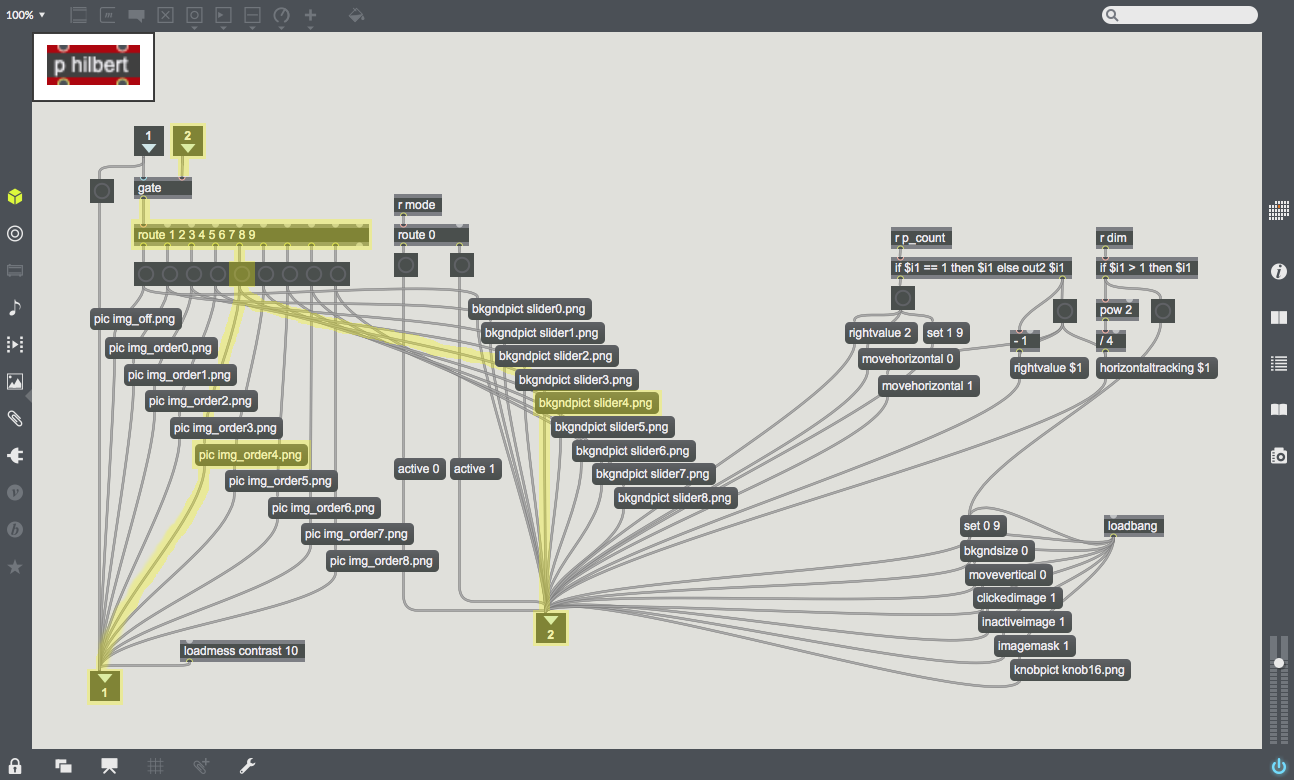 With the dimension level as an input, it gets routed and sent to a corresponding Hilbert Curve and slider image. On the far right are parameters for the slider. |
|


